


![mermaid project documentation [shutterstock: 1532940698, SaltedLife]](https://e3zine.com/wp-content/uploads/2022/03/mermaid-project-documentation-shutterstock_1532940698.jpg)
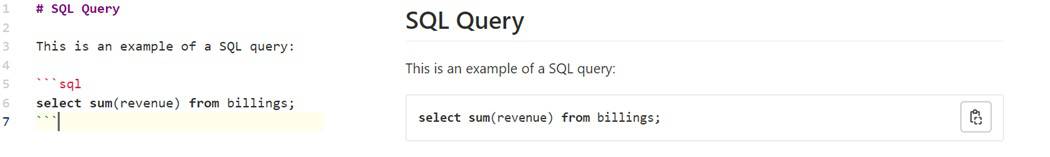
The first time I came into contact with Mermaid was in GitLab. When writing documentation in the markdown syntax, code examples are added via three backticks (“`) and optionally followed by a syntax hint. In the example below, the code on the left shall be formatted using the SQL syntax hint and the output renders the SQL key words in bold as result. A standard feature everybody knows.
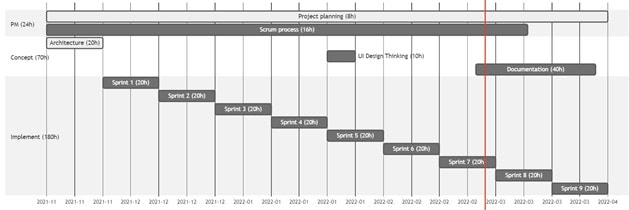
However, there is another supported syntax hint in GitLab: Mermaid. Example: The text shows a project plan with sections, times and duration. And it has the mermaid syntax hint.
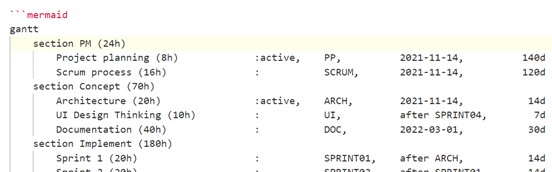
The rendering is a graphic, however!
Gitlab, GitHub, Azure Devops and others
The support of this syntax in Gitlab alone would not warrant an article, but a few weeks ago, it got activated in GitHub as well (see the official announcement). If you are using any of the natively supported DevOps platforms, I would highly recommend utilizing this feature.
However, even if the documentation is created in a customer wiki, chances are high it can be integrated easily. For example, there is a Confluence Plugin or a MediaWiki extension. It can also be used in any webpage using the mermaid.js library.
A full list of integration options is listed on the project home page here.
Flowchart types
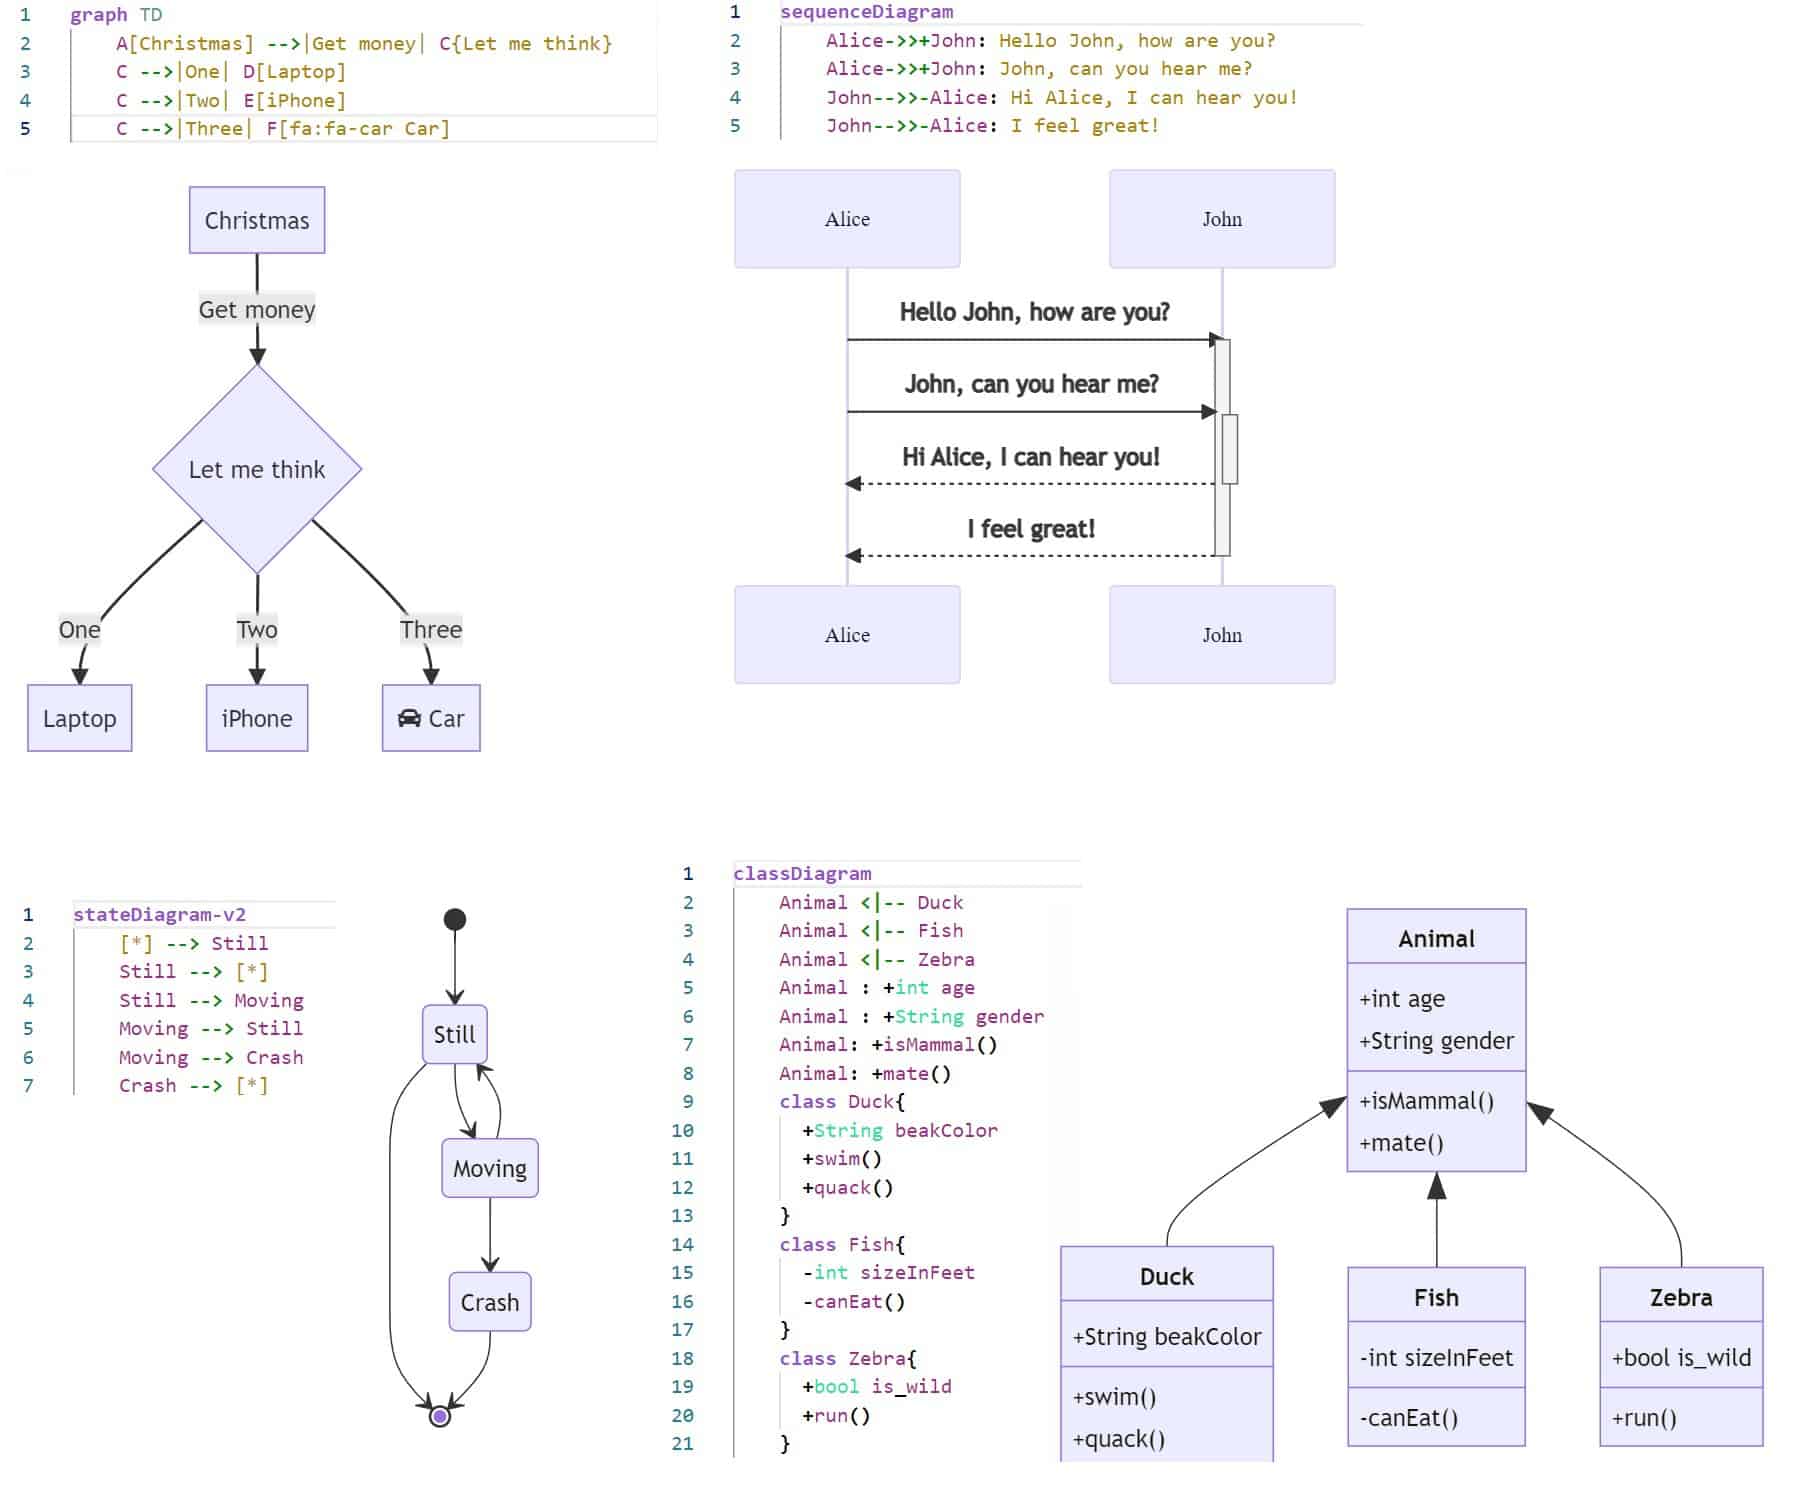
Gantt charts are not the only types of charts. It supports:
- Flowcharts to visualize decision trees;
- Sequence diagrams to visualize request-response sequences;
- Class diagrams to visualize object dependencies;
- State diagrams to visualize system behavior;
- Gantt charts to visualize project management dependencies;
- ER diagrams to visualize database tables and their relationships;
- User journeys to visualize design thinking aspects.
All these diagrams can be built with surprisingly little textual input.
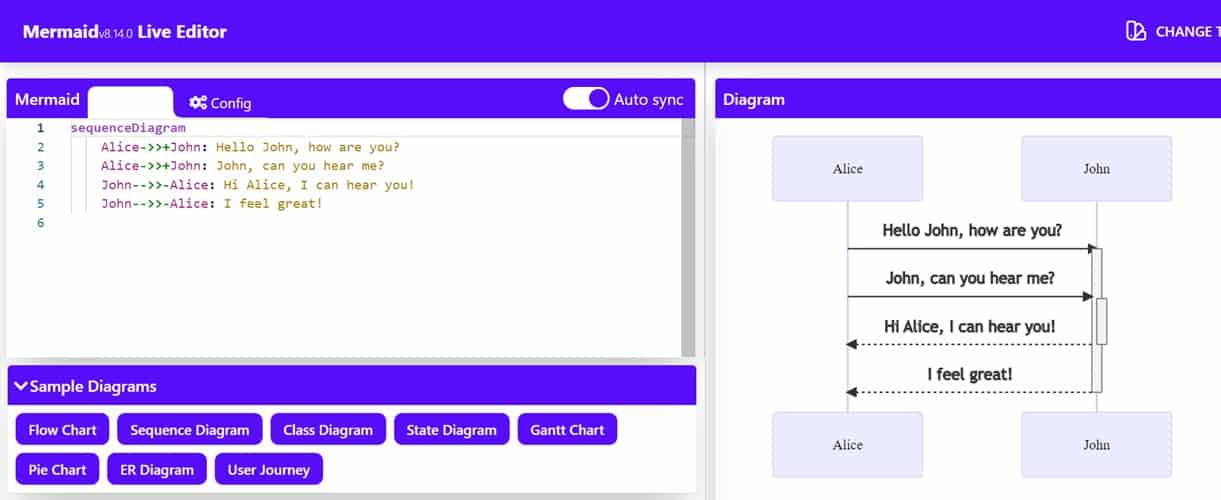
Interactive editor
A streamlined way to create those charts is to use the Mermaid interactive editor provided online. Here, the text input is immediately rendered, and syntax errors are highlighted.
In my opinion, these chart types add a whole new level of quality to the documentation. The only reason they are not used is because creating the images and keeping them up to date has always been time consuming – until now.

Add Comment